Satellite Crop Monitoring – How It Works and Does It Really Help Farmers?
Most farmers don’t see problems in the field until it’s too late.
By the time something is visible:
- the crop is already stressed
- yield is already affected
- decisions come too late
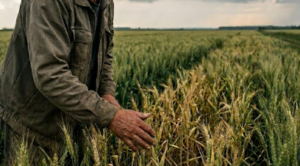
This is exactly where satellite crop monitoring becomes valuable.
But not in the way most people expect.
How satellite crop monitoring actually works
There is a common misconception:
“A satellite can tell me exactly what is wrong with my crop.”
It can’t.
Satellite monitoring does not directly detect:
- diseases
- exact nutrient deficiencies
- specific causes
What it actually does is detect changes in vegetation.
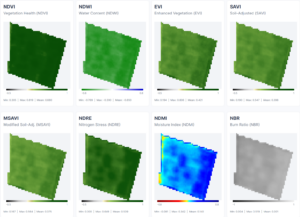
This is done through indices such as:
- NDVI (vegetation health)
- NDRE (nitrogen stress indication)
- NDWI / NDMI (water and moisture levels)
- EVI, SAVI, MSAVI (stability in different soil and canopy conditions)
- LAI, CHI (plant structure and chlorophyll content)
No single index gives a full answer.
👉 Real value comes from:
- combining multiple indices
- tracking changes over time
- comparing zones within the same field
The real problem farmers face
The issue is not a lack of data.
The real problem is:
- you cannot physically check every field every day
- you don’t know where to go first
- you react too late
That delay is where yield losses begin.
What satellite monitoring actually solves
Satellite monitoring does not replace field scouting.
It improves it.
👉 It tells you where to go and when to react
With FarmBooker, farmers can:
- view all fields at once using a selected index
- analyze a single field with multiple indices
- track changes up to 7 years
- monitor field variability over time
Satellite images are typically available every few days, depending on weather conditions.
Cloud coverage is handled by:
- removing pixels affected by clouds and shadows
- visually indicating lower-quality data days
This ensures decisions are based on reliable data, not just nice-looking images.
Field example: irrigation system performance
On one field, satellite data showed a clear difference between two pivot systems.
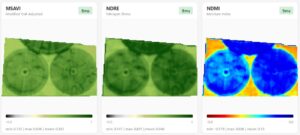
- The right pivot appeared more uniform
- The left pivot showed visible striping patterns
Conclusion and recommendation:
The most significant difference is observed between the two main pivots.
The right pivot shows better uniformity and overall nitrogen status.
On the left pivot, visible striping patterns suggest a mechanical issue.
👉 Recommendation: check nozzle flow consistency and pivot performance.
Additionally, considering the timing (mid-August), areas outside irrigation coverage (corners) have already lost a significant portion of their production potential, which is clearly visible on the NDMI map.
Operational example: harvest planning
Satellite data also helped optimize wheat harvest decisions.
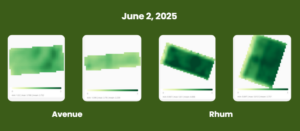
Instead of harvesting fields sequentially or by assumption:
👉 fields were prioritized based on actual crop condition
Result:
- better organization of harvest operations
- reduced losses from delayed harvesting
- more efficient use of machinery and labor
Satellite monitoring turned harvest planning from estimation into a data-driven decision.
The biggest mistake in using satellite data
Relying on a single index.
For example:
NDRE may indicate stress.
But it does not explain the cause.
It could be:
- water stress
- soil variability
- disease pressure
- nutrient imbalance
That is why proper interpretation always includes:
- multiple indices
- time-based analysis
- field verification
What’s next
Today, farmers can:
- detect variability
- identify critical zones
- monitor crop development
Next step:
👉 automated reports that highlight:
- where the issue is
- what the likely cause is
- where to go in the field
Because the goal is not to analyze indices.
The goal is to make better decisions, faster.
FAQ – Satellite crop monitoring
Can satellites detect crop diseases?
No. Satellites detect stress signals, not the exact cause. However, FarmBooker allows you to react 7 to 10 days before symptoms become visible to the naked eye. It doesn’t replace the agronomist; it tells them exactly where to go and which plant to sample before the damage spreads.
How often are satellite images available?
Typically every 2 to 5 days, depending on weather and cloud coverage. To ensure you’re always working with reliable information, FarmBooker automatically filters out low-quality data and cloud shadows, so your decisions are never based on “ghost” images.
Which index is the most important?
No single index gives a full answer. True value comes from combining indices over time. While NDVI shows general health, NDRE might signal nitrogen stress, and NDWI tracks water availability. FarmBooker integrates all of these into one platform, allowing you to compare current data with up to 7 years of history for that specific field.